
Setting up SonarQube is a notoriously painful experience. Elasticsearch configuration errors, plugin installation failures, persistent database management, project registration headaches, and quality profile tuning that takes days to get right. Most teams either abandon SonarQube after the initial setup struggle or maintain a fragile, always-on instance that drifts out of configuration over time.
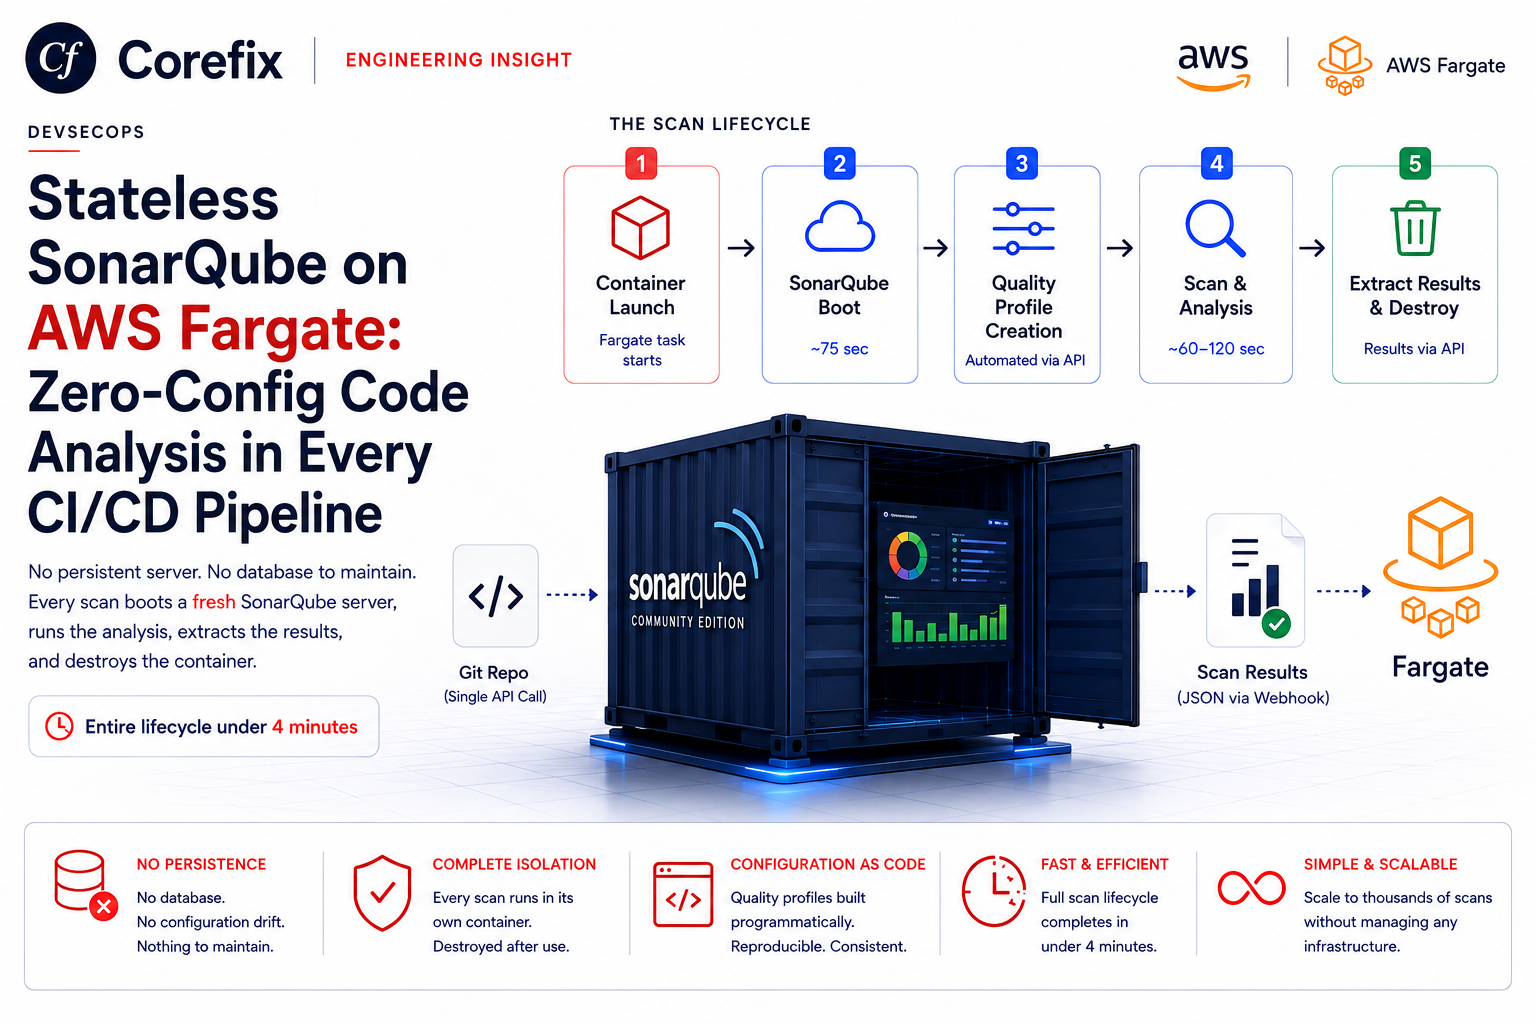
We took a different approach: SonarQube as a disposable, stateless container on AWS Fargate. No persistent instance. No database to maintain. No configuration drift. Every scan boots a fresh SonarQube server, runs the analysis, extracts the results, and destroys the container. The entire lifecycle takes under 4 minutes, and the developer doesn't configure a single thing.
This post covers the architecture, the Docker image optimization, the automated quality profile system, and the hard-won lessons from running thousands of scans in production.
Why Stateless?
Traditional SonarQube deployments assume a persistent server. You install it once, configure quality gates, register projects, onboard teams, and accumulate scan history over months. This model has three fundamental problems for a multi-tenant scanning platform:
Infrastructure burden. SonarQube requires Elasticsearch, a PostgreSQL or MySQL database, and the web server itself. Keeping this stack healthy across updates, managing disk space for Elasticsearch indices, handling database migrations — it's a full-time ops concern for a tool that runs intermittently.
Configuration drift. Quality profiles accumulate rule changes over time. Plugins get updated. New language analyzers ship with different default rules. Six months after initial setup, the scan results are driven by accumulated configuration decisions that nobody fully remembers or documented.
Multi-tenant isolation. When scanning code from different customers or repositories, a persistent SonarQube instance accumulates project data across tenants. Even with project-level isolation, the shared infrastructure creates compliance concerns.
Stateless solves all three. Every scan starts clean. There's no infrastructure to maintain between scans. Configuration is code — the quality profile is built programmatically from a known set of rules. And tenant isolation is absolute because the entire server is destroyed after each scan.
Architecture Overview
The scan lifecycle follows five stages, all automated:
┌─────────────┐    ┌──────────────┐    ┌───────────────┐    ┌──────────────┐    ┌──────────────┐
│  Fargate    │    │  SonarQube   │    │  Quality      │    │  Scan &      │    │  Extract &   │
│  Container  │───▶│  Boot        │───▶│  Profile      │───▶│  Analysis    │───▶│  Destroy     │
│  Launches   │    │  (~75 sec)   │    │  Creation     │    │  (~60-120s)  │    │  Container   │
└─────────────┘    └──────────────┘    └───────────────┘    └──────────────┘    └──────────────┘
Stage 1: Container launch. A Fargate task spins up from our pre-built Docker image. The image contains SonarQube Community Edition, the sonar-scanner CLI, JDK 17, Maven, and Gradle — everything needed to compile and scan Java projects.
Stage 2: SonarQube boot. The entrypoint script starts SonarQube's internal Elasticsearch, web server, and compute engine. We poll the health endpoint until the server reports healthy. This takes approximately 75 seconds — the longest stage, dominated by Elasticsearch initialization.
Stage 3: Quality profile creation. Our orchestrator programmatically creates quality profiles for every supported language using SonarQube's web API. Rules are activated based on type and severity filters — no manual configuration, no clicking through the UI.
Stage 4: Scan and analysis. The source code is scanned using sonar-scanner. For Java projects, we compile first using the project's own Maven wrapper or Gradle wrapper to produce bytecode. The scanner uploads results to the local SonarQube instance, which processes them through its compute engine.
Stage 5: Extract and destroy. We fetch the findings and pre-computed metrics through the API, package them into a structured JSON payload, and send the results to our backend via webhook. The Fargate task terminates, and the container is destroyed.
The entire process is triggered by a single API call with just a repository URL. Zero configuration from the developer.
The Docker Image
The base image is SonarQube Community Edition. We layer build tools on top for compiled language support:
FROM sonarqube:26.1.0.118079-community

USER root

RUN apt-get update && \
    apt-get install -y --no-install-recommends \
        curl git unzip ca-certificates gnupg wget \
        openjdk-17-jdk && \
    curl -fsSL https://deb.nodesource.com/setup_22.x | bash - && \
    apt-get install -y nodejs && \
    apt-get clean && rm -rf /var/lib/apt/lists/* /tmp/*

# Maven — install manually to get a modern version
# apt-get's maven is 3.6.3 which can't handle --release 17
ENV MAVEN_VERSION=3.9.9
RUN curl -fsSL "https://archive.apache.org/dist/maven/maven-3/${MAVEN_VERSION}/binaries/apache-maven-${MAVEN_VERSION}-bin.tar.gz" \
        -o /tmp/maven.tar.gz && \
    tar -xzf /tmp/maven.tar.gz -C /opt && \
    ln -s /opt/apache-maven-${MAVEN_VERSION}/bin/mvn /usr/local/bin/mvn && \
    rm /tmp/maven.tar.gz

# Gradle
RUN curl -fsSL "https://services.gradle.org/distributions/gradle-8.8-bin.zip" \
        -o /tmp/gradle.zip && \
    unzip /tmp/gradle.zip -d /opt && \
    ln -s /opt/gradle-8.8/bin/gradle /usr/local/bin/gradle && \
    rm /tmp/gradle.zip

# sonar-scanner CLI
ENV SONAR_SCANNER_VERSION=8.0.1.6346
RUN curl -fsSL "https://binaries.sonarsource.com/Distribution/sonar-scanner-cli/sonar-scanner-cli-${SONAR_SCANNER_VERSION}-linux-x64.zip" \
        -o /tmp/sonar-scanner.zip && \
    unzip /tmp/sonar-scanner.zip -d /opt && \
    mv /opt/sonar-scanner-${SONAR_SCANNER_VERSION}-linux-x64 /opt/sonar-scanner && \
    rm /tmp/sonar-scanner.zip && \
    ln -s /opt/sonar-scanner/bin/sonar-scanner /usr/local/bin/sonar-scanner

ENV SONAR_SCANNER_OPTS="-Dsonar.scanner.skipJreProvisioning=true"
ENV SONAR_ES_BOOTSTRAP_CHECKS_DISABLE=true
Image Size Evolution
Our Docker image went through three major iterations:
| Version | Size | What Changed |
|---|---|---|
| v1 (Kitchen sink) | 4.6 GB | JDK 11+17, .NET SDK, Mono, GCC, CMake, cppcheck |
| v2 (Trimmed) | 3.8 GB | Dropped JDK 11, replaced mono-complete with mono-devel |
| v3 (Focused) | 3.0 GB | Dropped .NET, Mono, C++ tooling entirely |
What we removed and why:
| Removed | Savings | Reason |
|---|---|---|
| openjdk-11-jdk | ~400 MB | JDK 17 compiles Java 11 code |
| gcc, g++, cmake | ~300 MB | No C++ taint analysis in Community Edition |
| mono-complete | ~600 MB | .NET scanning without compilation adds no security value |
| .NET 8.0 SDK | ~400 MB | Same reason |
| cppcheck + sonar-cxx plugin | ~60 MB | Pattern-match findings covered by other scanners |
The realization that drove v3: Community Edition doesn't do taint analysis for any language. The compilation infrastructure for C++ and .NET was producing pattern-match findings identical to what our other scanners already caught.
Elasticsearch Tuning for Ephemeral Containers
SonarQube's embedded Elasticsearch is the primary boot-time bottleneck. Two critical configuration changes make it work in stateless mode:
ENV SONAR_ES_BOOTSTRAP_CHECKS_DISABLE=true
ENV SONAR_SEARCH_JAVAOPTS="-Xmx2g -Xms2g -Des.disk.threshold.enabled=false \
    -Dcluster.routing.allocation.disk.threshold_enabled=false"
ENV SONAR_WEB_JAVAOPTS="-Xmx512m -Xms128m"
ENV SONAR_CE_JAVAOPTS="-Xmx512m -Xms128m"

RUN echo "cluster.routing.allocation.disk.threshold_enabled: false" \
    >> /opt/sonarqube/elasticsearch/config/elasticsearch.yml
The disk threshold settings are essential. Fargate tasks run on ephemeral storage, and Elasticsearch's default disk watermark checks will prevent the node from starting if available disk space falls below its threshold. Disabling these checks lets Elasticsearch boot without complaining about disk allocation. This is the number one reason stateless SonarQube fails on first attempt.
Automated Quality Profile System
SonarQube ships with over 2,000 rules per language. We run the default profile (all rules active) to get comprehensive metrics for health scoring, then use targeted API filters when fetching individual findings.
Profile Creation Across All Languages
SonarQube requires one quality profile per language per project. Our orchestrator creates profiles for all 28 supported languages:
async attachGlobalQualityProfile(projectKey, profileBaseName) {
    const languages = await this.getLanguages();

    for (const lang of languages) {
        try {
            await this.ensureQualityProfile(profileBaseName, lang.key);
            await this.addProjectToQualityProfile(
                projectKey, profileBaseName, lang.key
            );
        } catch (err) {
            console.warn(`Failed for ${lang.key}: ${err.message}`);
        }
    }
}
This creates 28 profiles in approximately 15 seconds. The creation is fast enough that optimizing it further isn't worth the added complexity.
Actionable Finding Filters
We fetch only findings that developers should act on:
async getActionableIssues(projectKey) {
    const allIssues = [];
    const seen = new Set();

    const filters = [
        { types: 'VULNERABILITY' },
        { types: 'BUG', severities: 'BLOCKER,CRITICAL' },
        { types: 'BUG', tags: 'cwe' },
    ];

    for (const filter of filters) {
        const issues = await this.getIssues(projectKey, filter);
        for (const issue of issues) {
            if (!seen.has(issue.key)) {
                seen.add(issue.key);
                allIssues.push(issue);
            }
        }
    }

    // Security hotspots — separate API endpoint
    const hotspots = await this.getHotspots(projectKey);
    allIssues.push(...hotspots);

    return allIssues;
}
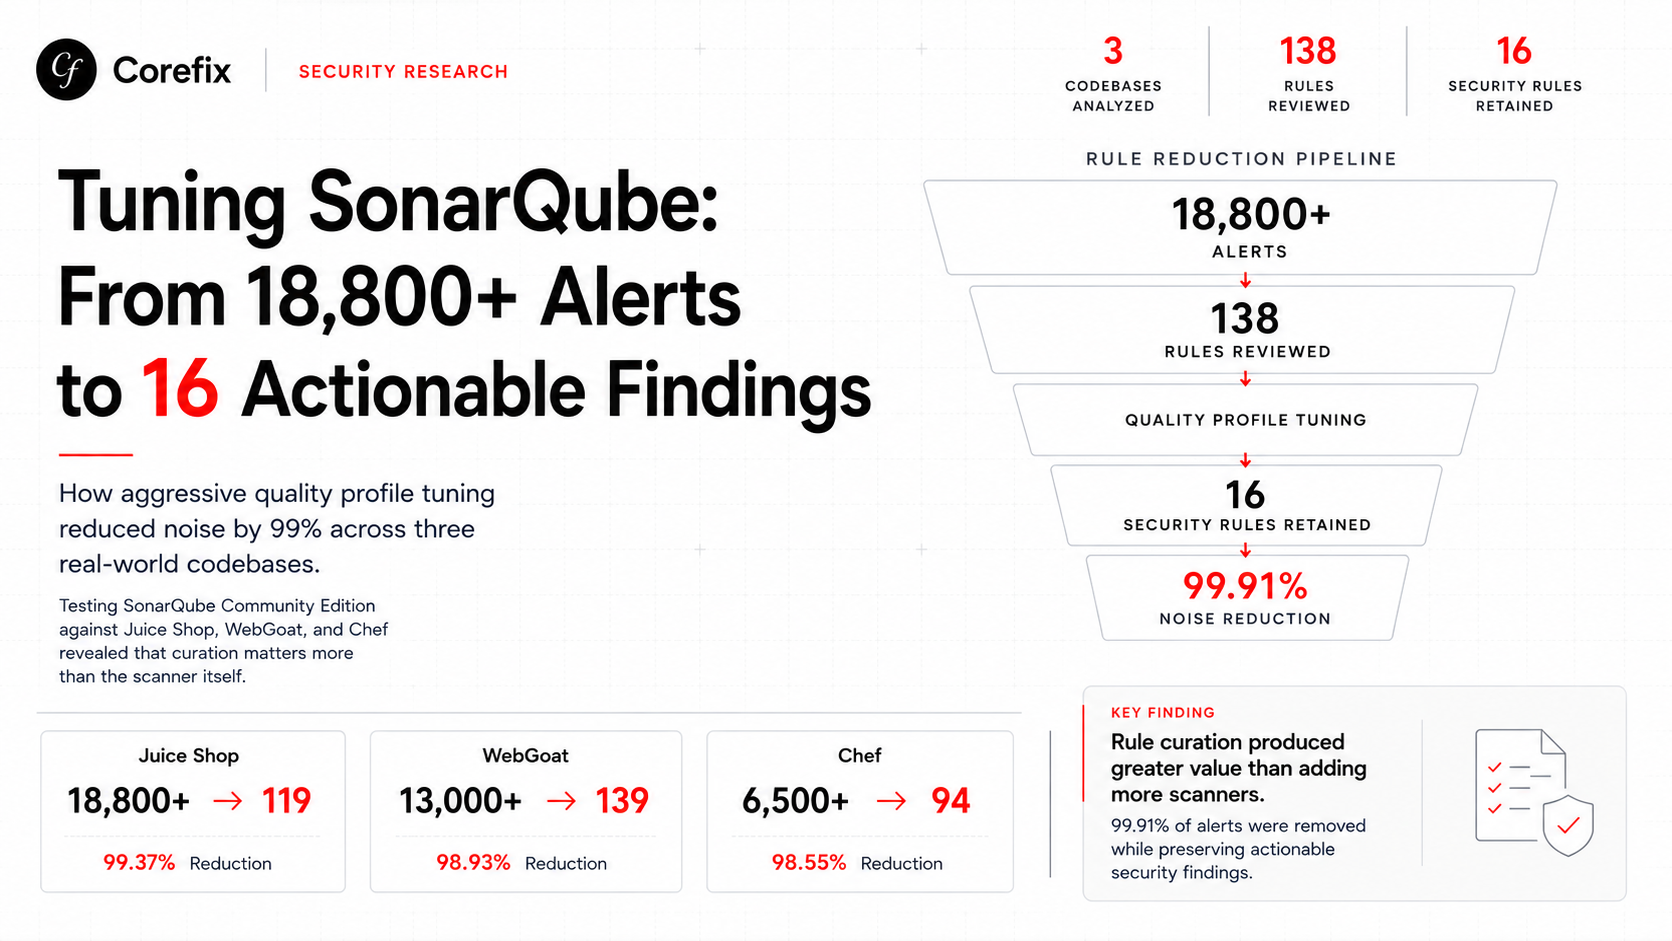
The Noise Reduction Journey
We arrived at these filters through systematic testing across three deliberately vulnerable and real-world codebases:
| Codebase | Default Profile | Tuned Profile | Reduction | Unique Rules |
|---|---|---|---|---|
| OWASP Juice Shop (JS/TS) | 18,800+ | 119 | 99.37% | 7 |
| OWASP WebGoat (Java) | 13,000+ | 139 | 98.93% | 18 |
| Chef (Ruby, real-world) | 6,500+ | 94 | 98.55% | 16 |
Each severity tier we removed cut the finding count by roughly half — a consistent pattern across all three codebases. CWE-tagged code smells were the biggest noise contributor: even filtering to BLOCKER/CRITICAL severity, they produced 94 findings on the Chef codebase. SonarQube maps things like TODO comments to CWE-546 and assigns them CRITICAL severity.
The final filter set catches vulnerabilities, crash-causing bugs, security-adjacent bugs with CWE mappings, and security hotspots — nothing else.
Project Type Detection and Build Pipeline
For interpreted languages, sonar-scanner runs directly on source files. For Java, we compile first using the project's own build wrapper:
if (projectType === 'java-maven') {
    const hasMvnw = fs.existsSync(path.join(repoDir, 'mvnw'));
    const mvnCmd = hasMvnw ? './mvnw' : 'mvn';

    if (hasMvnw) execSync('chmod +x mvnw', { cwd: repoDir });

    cmd = `${mvnCmd} clean compile -DskipTests && sonar-scanner \
        -Dsonar.projectKey=${projectKey} \
        -Dsonar.sources=. \
        -Dsonar.host.url=${sonarHost} \
        -Dsonar.token=${token} \
        -Dsonar.projectBaseDir=${repoDir} \
        -Dsonar.java.binaries=target/classes`;
}
Dynamic JAVA_HOME Detection
Hardcoded JDK paths break across different environments. We detect at runtime:
try {
    process.env.JAVA_HOME = execSync(
        'dirname $(dirname $(readlink -f $(which javac)))',
        { encoding: 'utf-8' }
    ).trim();
} catch {}
Graceful Build Failure
If compilation fails, we fall back to source-only scanning:
try {
    execSync(cmd, { cwd: repoDir, timeout: 1800000, stdio: 'inherit' });
} catch (e) {
    console.warn('Build failed. Falling back to source-only scan.');
    execSync(fallbackCmd, { cwd: repoDir, timeout: 1800000, stdio: 'inherit' });
}
Source-only scanning still returns useful pattern-match findings. The developer gets results either way.
Two Outputs from One Scan
Pre-Computed Metrics (Health Scoring)
SonarQube computes aggregate metrics during analysis. One API call returns everything needed for scoring:
{
    "bugs": "729",
    "code_smells": "13200",
    "vulnerabilities": "6",
    "security_hotspots": "116",
    "duplicated_lines_density": "3.5",
    "ncloc": "46950",
    "coverage": "0.0"
}
These metrics reflect the full analysis (all 13,200+ code smells) without requiring the user to see individual findings. A codebase with 13,200 code smells across 46,950 lines has a maintainability density of 281 per thousand lines — that maps to a dashboard score, not a wall of findings.
Security Hotspots: The Separate API
SonarQube stores security hotspots in a completely separate API endpoint from regular issues. The metrics API reports them (security_hotspots: 116), but they never appear in /api/issues/search. You must call /api/hotspots/search and normalize the response:
async getHotspots(projectKey) {
    const data = await this.request({
        method: 'GET',
        url: '/api/hotspots/search',
        params: { projectKey, ps: 500 }
    });

    return (data.hotspots || []).map(h => ({
        key: h.key,
        rule: h.ruleKey,
        severity: h.vulnerabilityProbability === 'HIGH' ? 'BLOCKER' :
                  h.vulnerabilityProbability === 'MEDIUM' ? 'CRITICAL' : 'MAJOR',
        type: 'SECURITY_HOTSPOT',
        component: h.component,
        line: h.line,
        message: h.message,
        tags: [h.securityCategory],
    }));
}
Finding Normalization
Raw findings are grouped by rule — instead of 41 separate "private key disclosed" findings, we show one rule card with 41 locations:
function groupFindingsByRule(findings) {
    const grouped = {};

    for (const finding of findings) {
        if (!grouped[finding.rule]) {
            grouped[finding.rule] = {
                rule: finding.rule,
                description: finding.description,
                severity: finding.severity,
                type: finding.type,
                count: 0,
                locations: [],
            };
        }

        grouped[finding.rule].count++;
        grouped[finding.rule].locations.push({
            file: finding.component.split(':').slice(1).join(':'),
            line: finding.line,
            code_snippet: finding.code_snippet,
        });
    }

    return Object.values(grouped);
}
Performance
| Stage | Duration |
|---|---|
| Fargate task launch | ~10 seconds |
| SonarQube boot | ~75 seconds |
| Profile creation | ~15 seconds |
| Scan (small repo, <10k lines) | ~30 seconds |
| Scan (medium repo, 10k-100k lines) | ~60-90 seconds |
| Scan (large repo, 100k+ lines) | ~120-180 seconds |
| Results extraction | ~5 seconds |
| Total (medium repo) | ~3.5 minutes |
SonarQube runs as a parallel task alongside fast scanners. The user sees security findings within 30 seconds while SonarQube computes health scores in the background.
Fargate Resources
| Resource | Value |
|---|---|
| vCPU | 4 |
| Memory | 8 GB |
| Ephemeral storage | 30 GB |
| Timeout | 30 minutes |
Key Takeaways
Community Edition does not do taint analysis. We tested against OWASP WebGoat with full Java compilation. The taint engine is exclusive to Developer Edition ($13,000+/year). Community Edition performs AST-level pattern matching.
Default profiles are catastrophically noisy. 18,800+ findings on a small JavaScript project. 99%+ reduction through systematic profile tuning.
SonarQube's real value is aggregate metrics. Bug density, code smell density, duplication percentage — these power health scoring dashboards without overwhelming developers.
Filter at fetch time, not profile time. Run all rules for comprehensive metrics. Filter when fetching individual findings.
Maven wrappers prevent version hell. System-installed Maven 3.6.3 can't compile projects targeting Java 17. The project's own mvnw ships the right version.
Elasticsearch disk checks must be disabled. Ephemeral container storage triggers watermark protections. This is always the first thing that breaks.
Hotspots have a separate API. Easy to miss. Easy to lose 116 security-relevant findings.
Conclusion
Stateless SonarQube trades a fixed 75-second boot cost for zero configuration drift, absolute tenant isolation, and infrastructure that scales to zero between scans. The developer submits a repository URL and receives structured findings with health scores 3-4 minutes later.
The quality profile tuning is where the real value lies. Any team can install SonarQube. The difference between a useful scan and an ignored scan is curation.
No SonarQube knowledge required. No quality profile configuration. No infrastructure to maintain. That's what zero-config code analysis looks like.