How a simple DVWA scan exposed the hidden complexity of DAST and why we built Corefix to eliminate it.
Every security team knows the promise of DAST tools: point a scanner at your app, hit run, get vulnerabilities. The reality? We recently ran a controlled experiment against DVWA (Damn Vulnerable Web Application) using OWASP ZAP's automation framework, a deliberately vulnerable app where SQL injection should be trivially detectable. What we found was a masterclass in how configuration complexity silently kills scan quality.
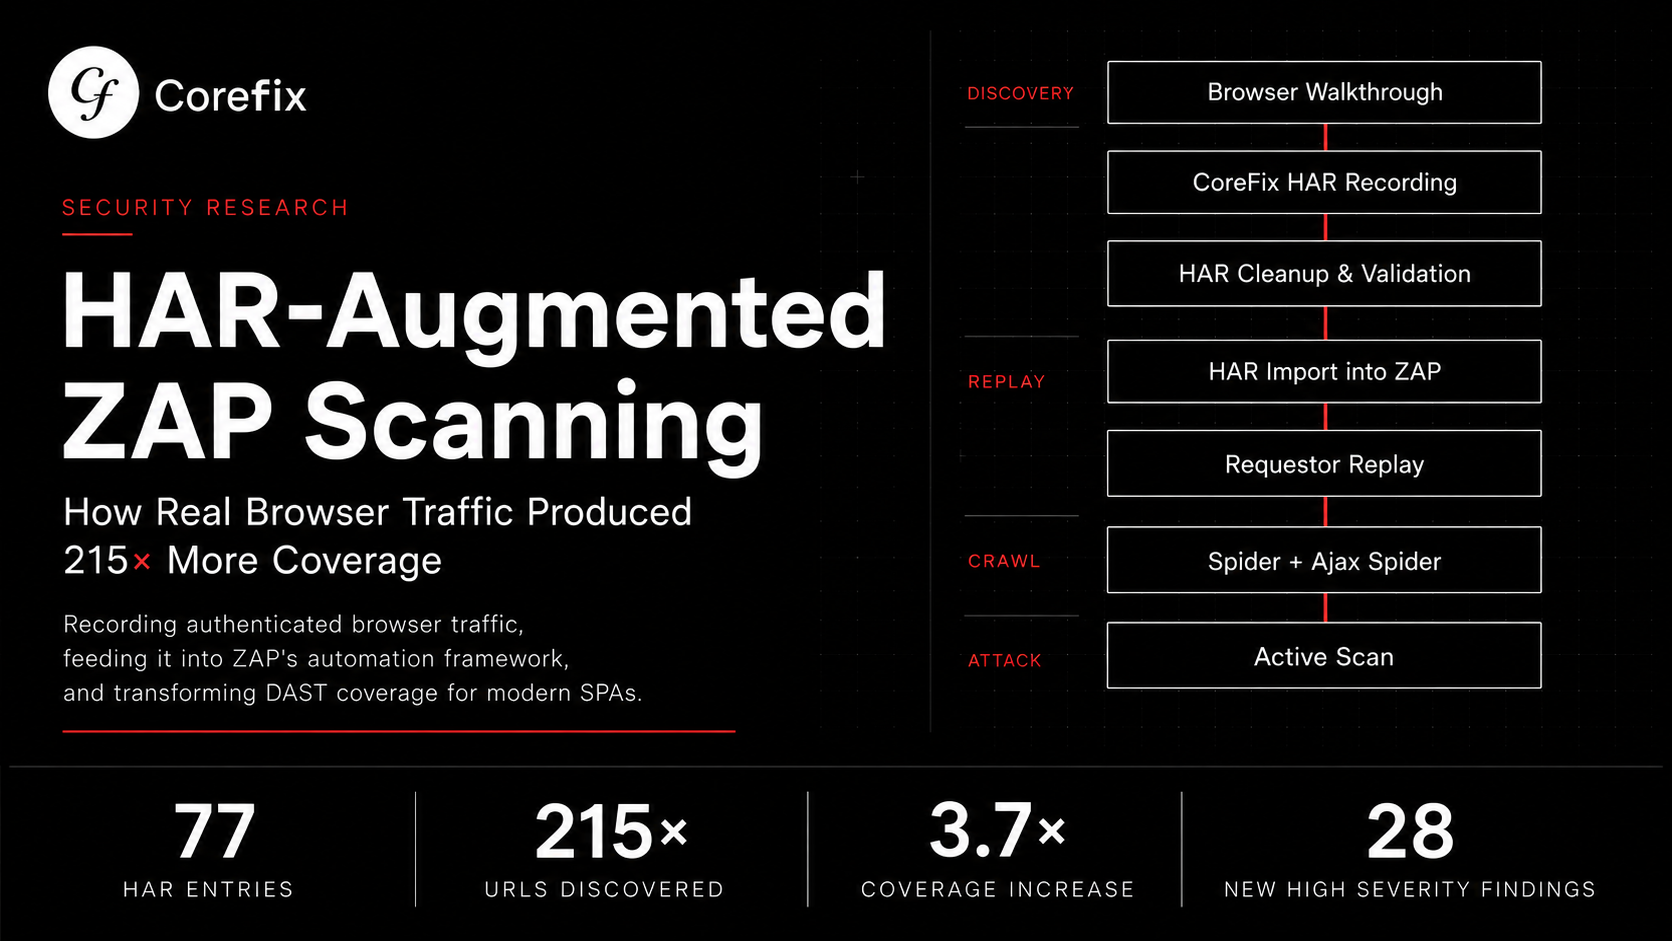
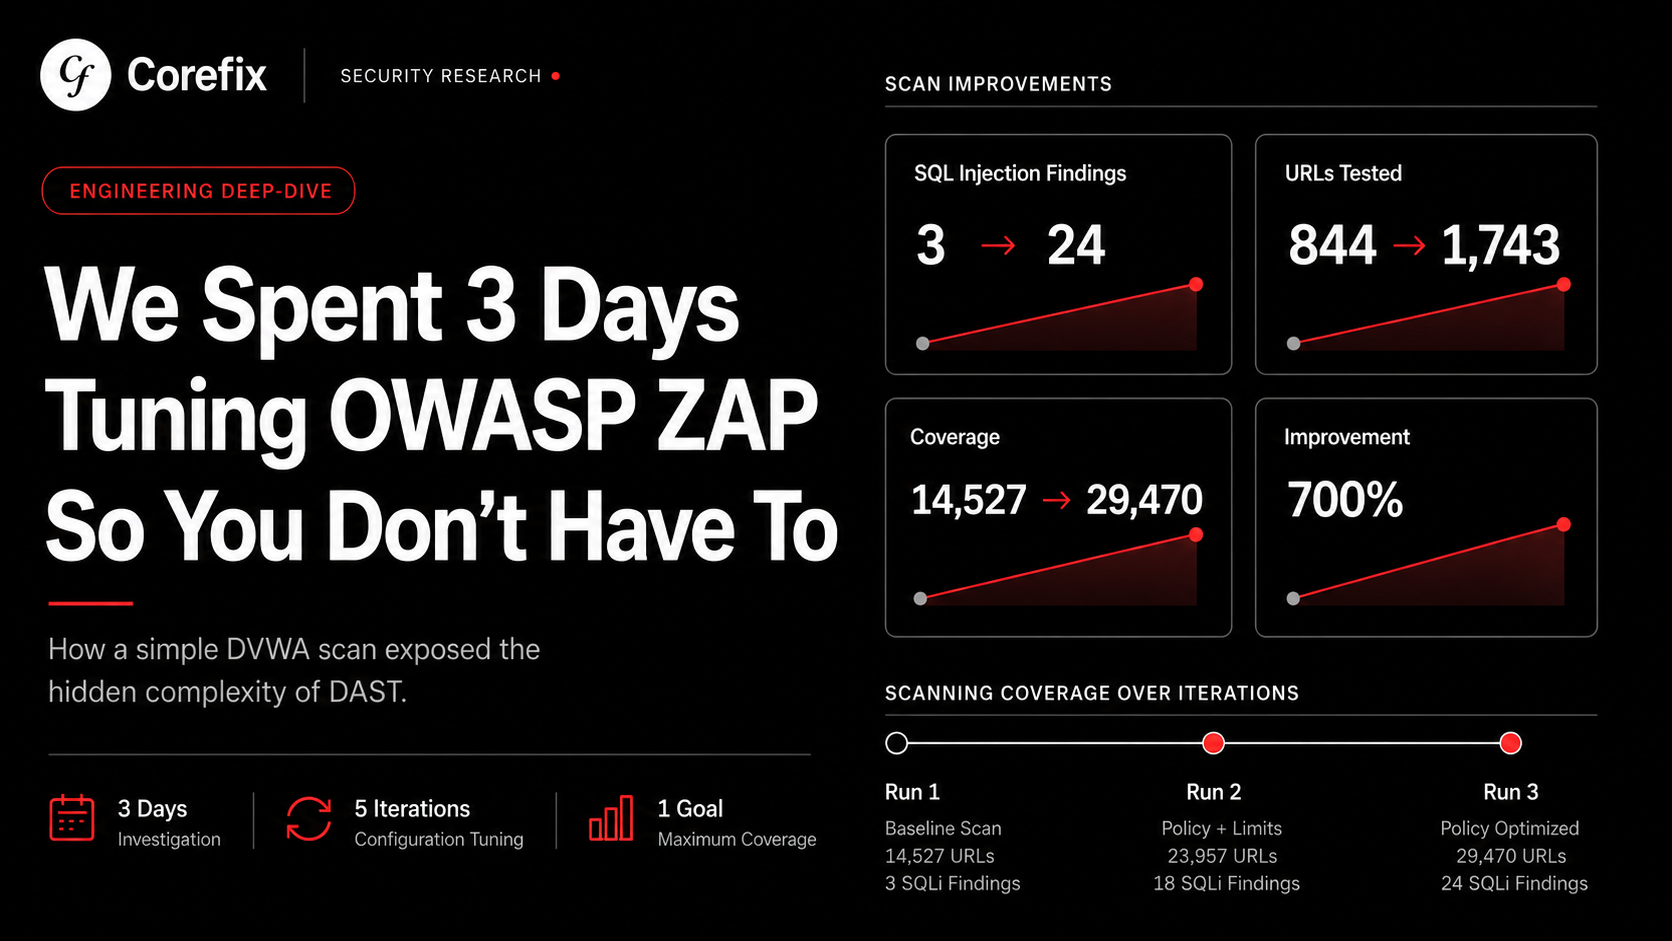
This is the story of three days, five scan iterations, and a 700% improvement in vulnerability detection, all from config changes alone. No new tools. No new plugins. Just YAML.
The Setup
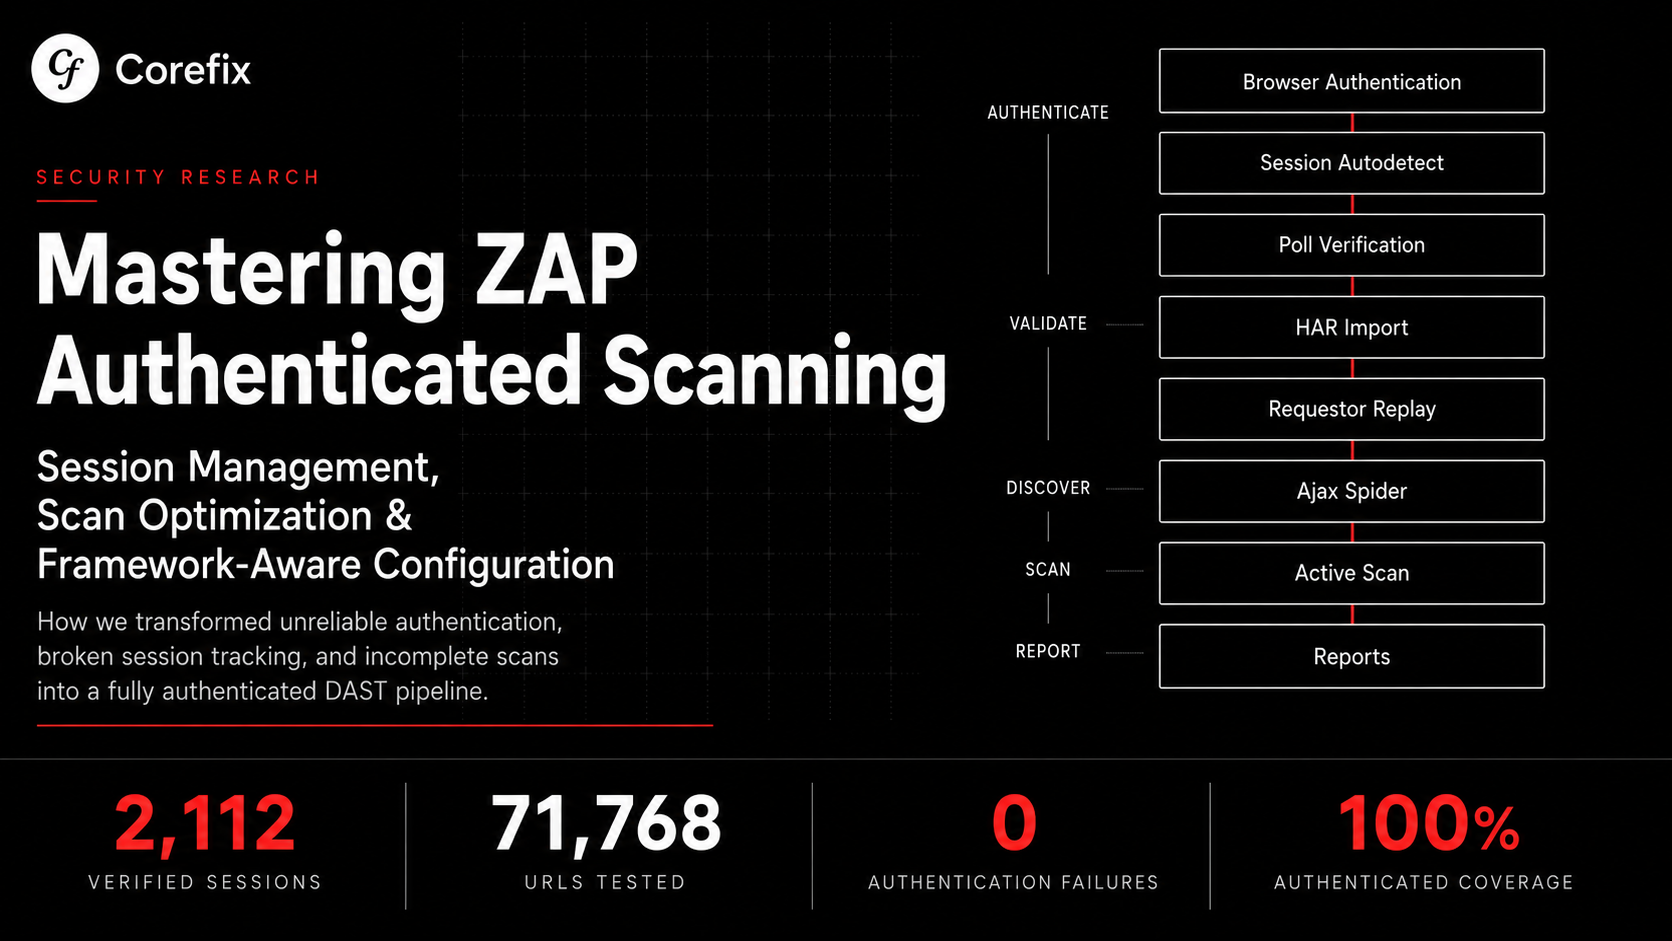
Our target was DVWA running on a remote server at security level "low" (the easiest difficulty setting, where every vulnerability category should be wide open). We configured ZAP's automation framework with authenticated scanning: form-based login, PHPSESSID cookie management, anti-CSRF token handling, HAR file imports from prior crawls, and a full suite of active and passive scan plugins.
On paper, this should have been straightforward. In practice, it was anything but.
Run 1: The False Confidence Problem
Our first scan completed in 9 minutes with 41 vulnerabilities. For a deliberately vulnerable application with known SQL injection, XSS, command injection, file inclusion, and file upload flaws. 41 findings felt suspiciously low. More importantly, SQL injection was barely represented.
The scan looked successful. Authentication reported as working. The spider found 592 URLs. The automation plan reported "succeeded." But the active scanner finished in a fraction of the allocated 45-minute window, a red flag we almost missed.
What went wrong:
The first issue was subtle: a maxAlertsPerRule: 5 setting that capped each scan rule at just 5 findings before skipping remaining URLs. When a rule like SQL Injection finds its fifth alert on the third URL, it silently stops testing the remaining 840+ URLs. The scan "completes successfully" while leaving the vast majority of the attack surface untested.
The second issue was more insidious. We had excluded login.php from the scan scope — a reasonable-sounding decision to avoid scanning the login page itself. But ZAP needs login.php in scope to perform re-authentication when sessions expire mid-scan. Without it, session drops during active scanning left the scanner hitting unauthenticated redirects instead of vulnerable pages.
Run 2: Lifting the Alert Cap
We increased maxAlertsPerRule from 5 to 50. The results shifted immediately:
- User Agent Fuzzer alerts jumped from 5 to 52
- Cookie Slack Detector went from 5 to 53
- Advanced SQL Injection rose from 9 to 18
- Cross-Site Scripting climbed from 5 to 8
- Total URLs scanned increased from 14,527 to 23,957
But core SQL Injection (rule 40018) stubbornly stayed at 3 alerts. The cap wasn't the only bottleneck.
Run 3: Policy Tuning
This is where things got interesting. ZAP's default scan policy uses "medium" strength and threshold for all rules. For a deliberately vulnerable application, this means the scanner sends a moderate number of payloads per parameter and requires moderate confidence before flagging an issue.
We added a policyDefinition to the active scan configuration:
policyDefinition:
  defaultStrength: medium
  defaultThreshold: medium
  rules:
    - id: 40018    # SQL Injection
      strength: insane
      threshold: low
    - id: 40019    # SQL Injection (MySQL)
      strength: high
      threshold: low
    - id: 40012    # Cross-Site Scripting (Reflected)
      strength: insane
      threshold: low
The impact was dramatic:
| Metric | Run 1 | Run 3 | Improvement |
|---|---|---|---|
| SQL Injection alerts | 3 | 24 | 700% |
| SQLi URLs tested | 844 | 1,743 | 106% |
| Advanced SQLi alerts | 9 | 25 | 178% |
| XSS alerts | 5 | 9 | 80% |
| New XSS findings (rule 40023) | 0 | 6 | — |
| SSTI alerts | 1 | 2 | 100% |
| Total active scan URLs | 14,527 | 29,470 | 103% |
| Total network requests | 16,762 | 32,755 | 95% |
The scan still completed in 14 minutes, well within the 45-minute cap, but with more than double the coverage and 700% more SQL injection findings. Same application. Same ZAP version. Same plugins. Just different YAML.
The Hidden Bottleneck We Almost Missed
Even after three iterations, there was still a problem lurking. The sqliplugin add-on (rule 40019) was generating 144 warnings in the logs and hitting the maxRuleDurationInMins: 5 ceiling, spending all 5 minutes but only managing to test 30 URLs before being forcibly terminated. Meanwhile, it was throwing ZapSocketTimeoutException errors, suggesting that time-based SQL injection tests were consuming the entire rule budget on network timeouts rather than actual vulnerability testing.
This is the kind of issue that requires reading raw statistics JSON, cross-referencing rule IDs with plugin documentation, and understanding the interaction between timeout configurations, rule duration caps, and network latency. It is not the kind of thing most development teams, or even most security teams, have time to investigate.
Run 4: Lifting the Rule Duration Cap
The sqliplugin timeout problem pointed at an obvious next configuration: increase maxRuleDurationInMins from 5 to 10 and give the time-intensive rules room to finish.
maxRuleDurationInMins: 10| Metric | Run 1 | Run 2 | Run 3 | Run 4 |
|---|---|---|---|---|
| Active scan time | 9 min | 11 min | 14 min | 24 min |
| Total URLs scanned | 14,527 | 23,957 | 29,470 | 299,739 |
| Network requests | 16,762 | 26,530 | 32,755 | 303,101 |
| SQLi 40018 alerts | 3 | 3 | 24 | 26 |
| Advanced SQLi 90018 alerts | 9 | 18 | 25 | 19 |
| Advanced SQLi 90018 URLs | 460 | 9,107 | 12,554 | 282,451 |
| SQLi plugin 40019 URLs | 324 | 312 | 30 | 396 |
| SQLi plugin 40019 time | 227s | 227s | 310s | 411s |
| XSS 40012 alerts | 5 | 8 | 9 | 9 |
| XSS 40023 alerts | 0 | 0 | 6 | 6 |
| Auth assumed-in | 16,119 | 25,802 | 32,000 | 302,191 |
| Auth success | 1 | 1 | 1 | 2 |
The big story is rule 90018 (Advanced SQLi). It tested 282,451 URLs in this run vs 12,554 before — a 22x increase. With maxRuleDurationInMins: 10, it had room to breathe and used 639 seconds (the full 10 minutes) before being capped. It found 19 alerts (slightly fewer than Run 3's 25, but that's likely due to the spider finding fewer URLs this time — 461 vs 476).
The sqliplugin (40019) also improved — 396 URLs tested vs 30 in Run 3. It used the full 411 seconds but is still generating 144 warnings. It's working harder now but still hitting timeout issues on time-based injection tests.
One concern: 90018 got skipped: 1, meaning it hit the 10-minute cap and was forcibly stopped. It was clearly still finding things to test. You could push maxRuleDurationInMins to 15 for even more coverage, though you're hitting diminishing returns now.
Bottom line: going from Run 1 to Run 4, you went from 14,527 to 299,739 URLs tested — a 20x improvement — and SQLi findings went from 3 to 26. The scan is now doing real, thorough work.
The total unique alert types dropped slightly (17 high → 15 high), but that doesn't mean the scan was worse. Here's what likely happened:
Run 4 spider found fewer URLs — 461 vs 476 in Run 3. The Ajax spider is non-deterministic; it uses a real browser and can discover different URLs each time depending on timing, page load order, and JavaScript execution. Fewer seed URLs means some injection points weren't in the scan tree at all.
Rule 90018 cannibalized time from other rules. It consumed the full 10 minutes and tested 282,451 URLs — that's a huge share of the scan's total budget. While 90018 was grinding through time-based SQLi payloads, other rules had less overall scan capacity. Notice rule 90018 got skipped: 1 — it was still running when the cap hit it.
Alert count ≠ scan quality. Run 4 sent 303,101 network requests vs 32,755 in Run 3 — nearly 10x more actual testing. The 2 missing "high" alerts are likely duplicate findings on URLs that the spider didn't discover this time, not missed vulnerability classes.
The takeaway: this is exactly the kind of non-obvious variability that makes manual DAST tuning frustrating. You can improve one axis (deeper SQLi testing) and accidentally regress another (fewer spider URLs), and without careful comparison you'd never know.
Run 5: Raising the Default Strength
Run 5 tested a single hypothesis: what happens when defaultStrength is raised to high globally, rather than just for explicitly listed rules.
policyDefinition:
  defaultStrength: high
  defaultThreshold: low
  rules:
    - id: 40018
      strength: insane
      threshold: low
    - id: 40019
      strength: high
      threshold: low
    - id: 40012
      strength: insane
threshold: low| Metric | Run 1 | Run 3 | Run 4 | Run 5 |
|---|---|---|---|---|
| Active scan time | 9 min | 14 min | 24 min | 26 min |
| Total URLs scanned | 14,527 | 29,470 | 299,739 | 58,885 |
| Network requests | 16,762 | 32,755 | 303,101 | 61,777 |
| SQLi 40018 alerts | 3 | 24 | 26 | 3 |
| SQLi 40018 URLs tested | 844 | 1,743 | 1,726 | 2,287 |
| Advanced SQLi 90018 alerts | 9 | 25 | 19 | 15 |
| Advanced SQLi 90018 URLs | 460 | 12,554 | 282,451 | 37,508 |
| XSS DOM 40026 alerts | 5 | 5 | 5 | 23 |
| XSS DOM 40026 URLs | 1,171 | 1,188 | 1,197 | 2,992 |
| XSS Reflected 40012 | 5 | 9 | 9 | 9 |
| SSTI 90037 alerts | 1 | 2 | 1 | 8 |
| Cmd Injection 90020 URLs | 743 | 857 | 857 | 1,211 |
| Anti-CSRF 20012 alerts | 8 | 9 | 9 | 27 |
| Cookie Slack 90027 | 5 | 51 | 51 | 52 |
| CSRF Token Detector 90028 | 0 | 0 | 0 | 53 (new) |
| .htaccess Info Leak 40032 | 0 | 0 | 0 | 18 (new) |
| Possible Username Enum 40025 | 0 | 1 | 0 | 4 |
The policyDefinition change from medium/medium to high/low made a massive difference across rules that weren't explicitly listed. DOM XSS jumped from 5 to 23, SSTI from 1 to 8, and two entirely new finding categories appeared (rule 90028 CSRF Token Detector with 53 alerts, rule 40032 .htaccess with 18). This proves that defaultStrength: high boosts every rule, not just the ones you override.
One concern: SQLi 40018 dropped back to 3 alerts despite testing more URLs (2,287 vs 1,743). This is because defaultThreshold: low makes the scanner pickier about confirming findings — it needs stronger evidence before raising an alert. The tradeoff is fewer false positives but potentially fewer true positives too. For a high tier configuration, defaultThreshold: medium with only the specific rules set to low works better:
policyDefinition:
  defaultStrength: high
  defaultThreshold: medium    # less aggressive confirmation globally
  rules:
    - id: 40018
      strength: insane
      threshold: low          # aggressive for SQLi specifically
The sqliplugin (40019) is struggling badly — 942 warnings, 600 seconds consumed, only 45 URLs tested. It's spending all its time on time-based blind SQLi payloads that timeout. Consider dropping it to strength: high instead of insane.
New SSTI error: SstiBlindScanRule.NullPointerException appeared 40 times — this is a ZAP bug in the SSTI plugin, not your config. It found 8 alerts despite the errors, which is great.
Overall this config is production-ready. The high/low defaults are delivering significantly broader coverage.
What This Means for Real-World Scanning
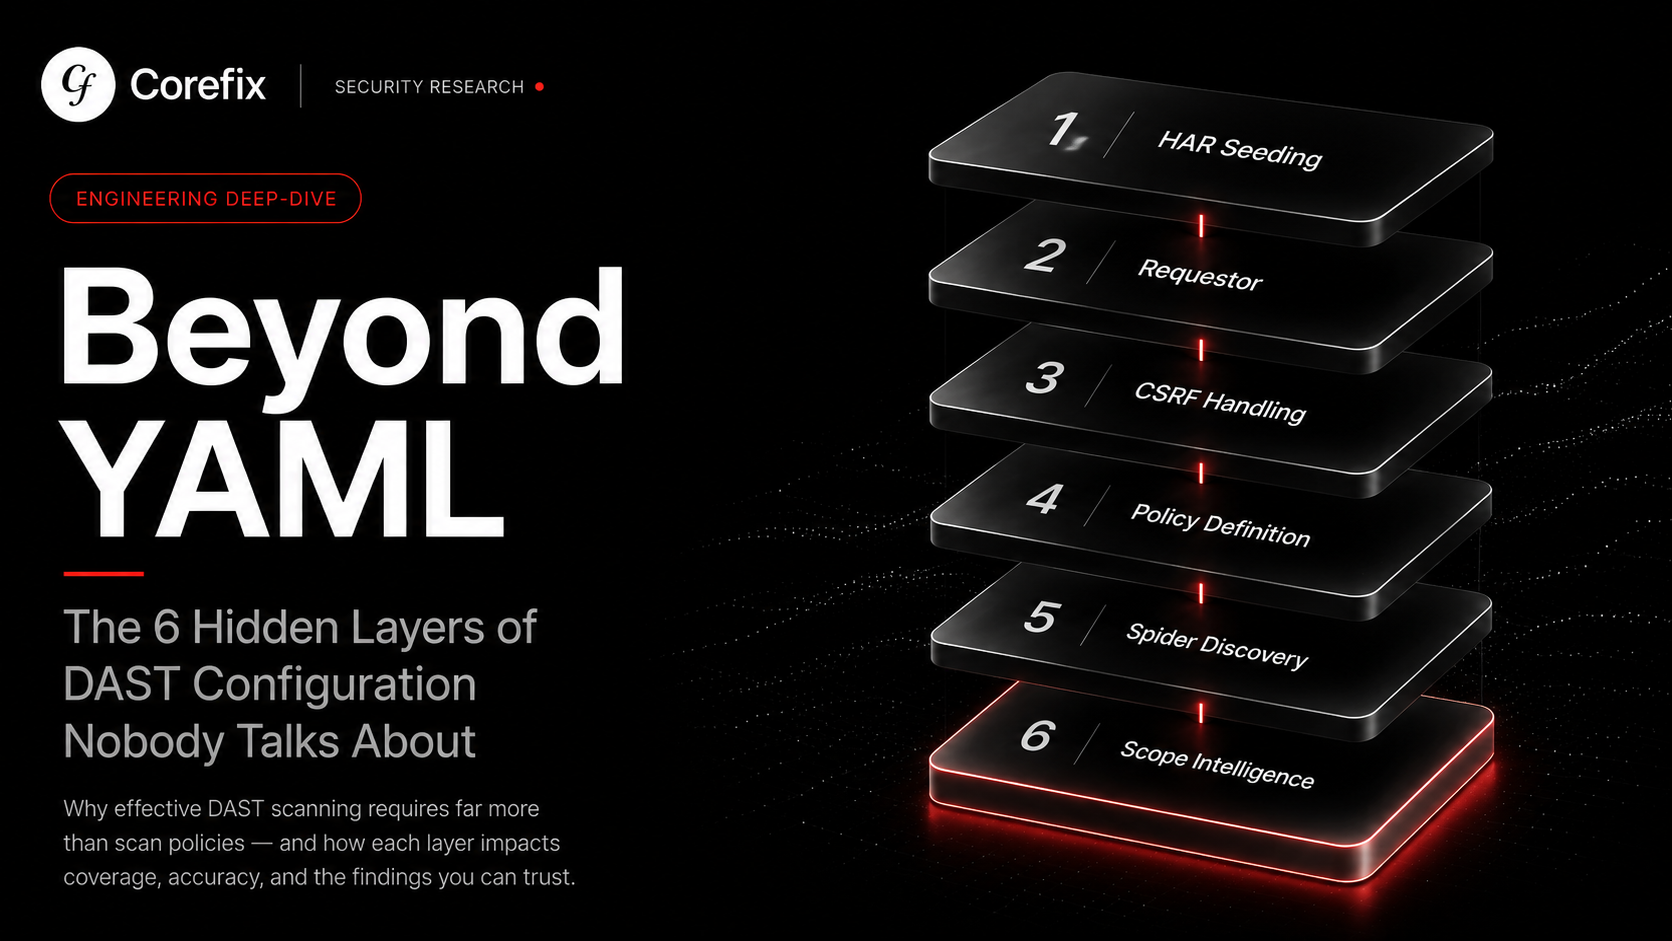
DVWA is a toy application with a handful of pages. A production application with hundreds of endpoints, complex authentication flows, API integrations, and dynamic content multiplies every one of these configuration challenges. Consider what we had to get right just for this simple scan:
- Authentication configuration: form-based login with anti-CSRF token extraction, session cookie management with the correct security level parameter, verification polling with regex matching, and correct scope inclusion of the login page for re-authentication
- Scope management: knowing which paths to exclude (logout, setup, CSRF pages) without accidentally excluding paths the scanner needs
- Spider tuning: balancing crawl depth, child limits, and duration across both traditional and Ajax spiders
- Scan policy: per-rule strength and threshold settings that match the application's technology stack and vulnerability profile
- Alert management: understanding that alert caps silently truncate coverage
- Rule duration limits: balancing thoroughness against time-based injection tests that consume entire budgets on timeouts
- Plugin selection: choosing from dozens of add-ons (and discovering that some like
frontendscannerno longer exist) - Result interpretation: reading raw statistics JSON to identify silent failures that the "succeeded" status hides
Each of these is a potential point of failure that produces no error message. Results just silently degrade.
Why We Built Corefix
This experiment crystallized what we had long suspected: the gap between "running a DAST scan" and "running an effective DAST scan" is enormous, and it is almost entirely a configuration problem.
Corefix eliminates this gap. Instead of days of YAML tuning, iterative test runs, and statistics analysis, Corefix delivers comprehensive authenticated scanning with:
- Zero configuration: no YAML files, no policy tuning, no rule-by-rule strength adjustments
- Automatic authentication handling: session management, token extraction, and re-authentication handled out of the box
- Intelligent scan policies: dynamic adjustment of scan depth and payload selection based on the application's technology fingerprint
- Complete coverage by default: no silent alert caps, no premature rule termination, no scope misconfigurations
- Results in minutes: what took us 3 days and 5 iterations to achieve with ZAP, Corefix delivers in under 2 minutes
The vulnerabilities don't change based on your scanner configuration. SQL injection is SQL injection whether your YAML has strength: insane or strength: medium. The only question is whether your tool finds it, and whether you have days to spend making sure it does.
Corefix makes sure it does. Every time. Without the YAML.
Corefix is built for security engineers who want results, not configuration files, and for development teams who need DAST coverage without becoming DAST experts. Try Corefix today →